[ad_1]
Note: This article’s statistics come from third-party sources and do not represent the opinions of this website.
Cats have become much more popular pets in recent years. While dogs remain the most common pet in most countries, cats aren’t that far behind, and the gap between pet cats and dogs seems to close more with each passing year.
More and more households throughout the world are adopting pet cats, and cat ownership trends are changing as a result. Here are some of the latest statistics on pet cats and how current trends look for cat ownership.

The 16 Cat Ownership Statistics
- In 2024, the US, China, and Russia have the highest cat ownership rates in the world.
- Between 2023 and 2024, 46.5 million US households own a cat.
- Vermont is the state with the highest rate of cat ownership at 44.6%.
- Millennials have the highest rate of pet ownership at 33%.
- 39% of homeowners have pet cats, while 29% of renters have pet cats.
- 43% of cat owners get their cats from a pet store, and 40% of cat owners adopt their cats from an animal shelter or rescue.
- Asheras are listed as one of the most expensive cat breeds in 2024 and can cost up to $125,000 per cat.
- 3 million cats entered animal shelters and rescues in 2023.
- 6 million shelter cats were adopted in 2023.
- Cat adoptions have increased by 14% since 2019.
- Cat owners spent between $314 to $755 on initial cat care costs.
- Cat owners spend between $961 to $2,487 on their cats annually.
- Cat owners spend the most on food, with $310 being the average annual spending.
- The average cost of pet insurance for cats is $30 a month.
- Gen Z cat owners are 16 times more likely than Baby Boomers to get pet insurance.
- 38% of cat owners thought they were financially ready for pet care expenses but actually were not.

Cat Ownership Demographics
1. In 2024, the US, China, and Russia have the highest cat ownership rates in the world.
(World Population Review)
The US is a pet-loving country and far surpasses other countries in pet ownership. There are an estimated 74 million domesticated cats in the US. China is second, with about 53 million pet cats, and Russia is third, with approximately 23 million pet cats. Germany, France, the UK, Italy, Ukraine, Japan, and Poland are subsequently among the top 10 countries with the highest number of pet cats.
2. Between 2023 and 2024, 46.5 million US households own a cat.
(APPA)
Cats are the second most popular pets in the US, with about 46.5 million US households having at least one pet cat. Dogs remain the most popular pet, with about 65.1 million US households having at least one pet dog. The third most popular pet is birds, and about 6.1 million US households have birds.

3. Vermont is the state with the highest rate of cat ownership at 44.6%.
(World Population Review)
Most US states have more pet dogs than cats. However, Vermont is among the few states that have households with more pet cats than dogs. 44.6% of pet owners in Vermont have pet cats, while 28.3% of pet owners have dogs. Maine is the only other state with more pet cats than dogs, with 43.6% of pet owners having cats and 35.9% of pet owners having dogs. The state with the lowest cat ownership rate within the contiguous US is Rhode Island. Rhode Island has a generally low pet ownership rate, and just 16.7% of pet owners have cats.
4. Millennials have the highest rate of pet ownership at 33%.
(APPA)
Millennials surpass Gen Z, Gen X, Baby Boomer, and Builder generations when it comes to pet ownership. Gen X comes second with a pet ownership rate of 25%. 24% of pet owners are Baby Boomers, and 16% of pet owners are Gen Z.
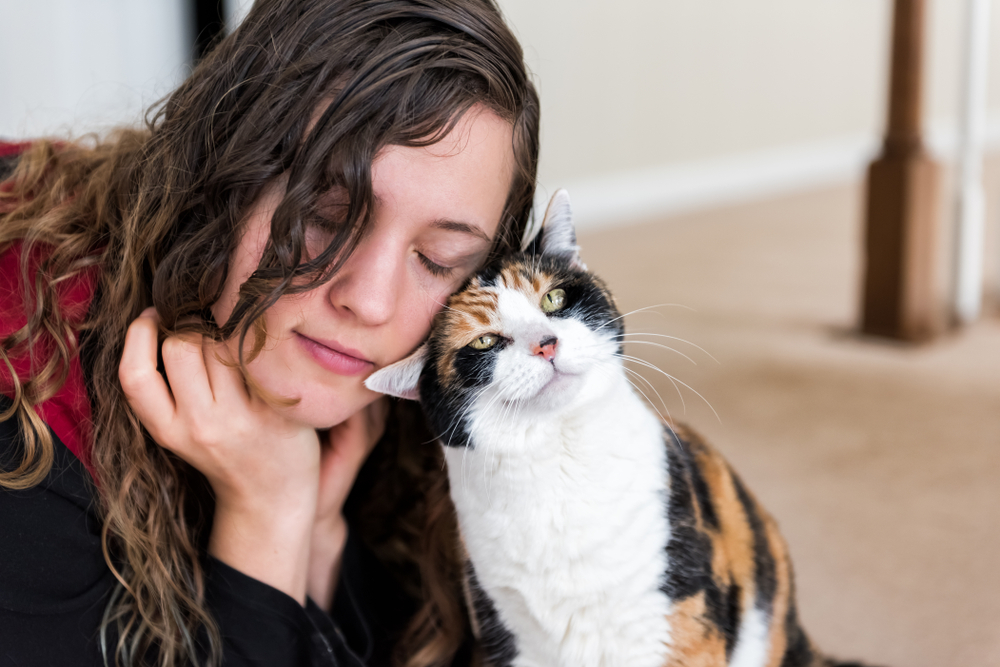
5. 39% of homeowners have pet cats, while 29% of renters have pet cats.
(AVMA)
The majority of cat owners are also homeowners. It’s likely that cat ownership among renters is lower due to limited rental housing options and pet fees that landlords charge to pet owners.

Cat Adoptions
6. 43% of cat owners get their cats from a pet store, and 40% of cat owners adopt their cats from an animal shelter or rescue.
(AVMA)
Cats are more likely to be adopted through a pet store or animal shelter. Many pet stores partner with local pet adoption agencies by temporarily housing adoptable cats and coordinating cat adoptions. Only about 7% of pet cats are acquired from a breeder.
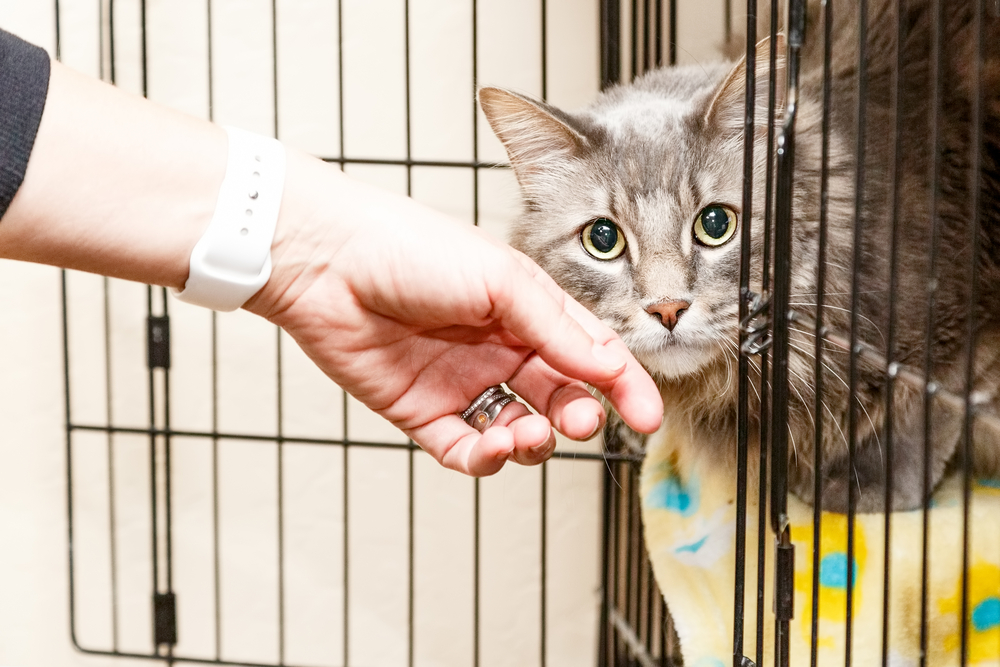
7. Asheras are listed as one of the most expensive cat breeds in 2024 and can cost up to $125,000 per cat.
(FinancesOnline)
Asheras were developed by crossbreeding African Servals, Asian Leopard Cats, and domesticated cats. They’re extremely rare because they’re challenging to breed, and one Ashera cat breeder produces about five Ashera kittens a year. Other expensive cat breeds include Savannahs, Bengals, Persians, and Peterbalds.
8. 3 million cats entered animal shelters and rescues in 2023.
(Shelter Animals Count)
The rate of cat intakes at animal shelters has fluctuated slightly since the COVID-19 pandemic. The 2023 rate is 3.2% lower than the 2019 rate. When compared to 2022, there was a 0.2% increase in cat intakes at animal shelters in 2023. Cat intakes and dog intakes are nearly the same, with 51% of animal intakes being cats and 49% of intakes being dogs.

9. 6 million shelter cats were adopted in 2023.
(Shelter Animals Count)
In 2023, cat adoptions were slightly higher than dog adoptions. 54% of pet adoptions involved a cat, while 46% involved dogs. 2023 also saw an increase in live outcomes, such as adoptions, being returned to owners, or feral cats being returned to the field. When compared to 2022 data, 166,000 more animals had a live outcome.
10. Cat adoptions have increased by 14% since 2019.
(ASPCA)
The number of cat adoptions has increased generally since 2019, with about 319,000 more cats getting adopted in 2023 than in 2019. The rate of intakes that led to adoptions increased from 59% in 2019 to 65% in 2023. There has also been an increase in the number of animals waiting for an outcome, including those in foster care and those transferring to different adoption organizations. Compared to 2022, 177,000 more animals have waited for an outcome in 2023.

Cat Ownership Spendings
11. Cat owners spent between $314 to $755 on initial cat care costs.
(Synchrony)
Initial cat care costs include adoption fees, purchasing supplies, and vet visits. These costs depend on the cat’s age and health condition. Spay and neuter fees are among the most significant factors that affect initial cat care costs, along with the type of cat food and pet insurance.
12. Cat owners spend between $961 to $2,487 on their cats annually.
(Synchrony)
Spending will depend on a variety of factors, including food, veterinary care visits, cat litter, and toys. Considering how the range of spending is relatively broad, it’s possible to make significant savings by choosing more budget-friendly cat care products. You can also experience more savings by choosing generic medication, shopping during sales, and signing up for subscription services.

13. Cat owners spend the most on food, with $310 being the average annual spending.
(AVMA)
Healthy cats don’t really have too many significant regular care costs other than food and cat litter. Cat owners can experience some savings by choosing affordable cat food that doesn’t significantly sacrifice quality. Scheduling mealtimes and monitoring how much a cat eats can help prevent food waste and ensure cats are eating just the right amount of food.
14. The average cost of pet insurance for cats is $30 a month.
(Forbes)
Pet insurance can help lessen the financial stress that comes from unexpected health diagnoses in cats. Diagnostic tests and treatments can easily reach thousands of dollars that cat owners would have to pay out-of-pocket. Pet insurance can help cover these costs, and most pet insurance plans for cats have average premiums that are lower than premiums for dogs. Pet insurance premiums are typically affected by the cat’s age and breed, and cities with higher living costs usually have the most expensive pet insurance premiums.

15. Gen Z cat owners are 16 times more likely than Baby Boomers to get pet insurance.
(MarketWatch)
Gen Z has been named the generation with the most responsible pet owners due to having the highest percentage of pet owners with pet insurance plans and the greater likelihood of taking their pets to the vet.
41.5% of Gen Z pet owners have pet insurance, and 33.1% are either interested or researching it. 14% of Gen Z pet owners think pet insurance is too expensive, and 9.4% believe it’s unnecessary.
In contrast, less than 3% of Baby Boomer pet owners have pet insurance. 37.9% believe pet insurance is too expensive, and 19.8% believe it’s unnecessary.
16. 38% of cat owners thought they were financially ready for pet care expenses but actually were not.
(Synchrony)
Cats are typically more budget-friendly than dogs, but they can still take up a significant portion of your budget. Cat care fees vary depending on a cat’s age and breed, and cats have a higher risk of developing a chronic health issue as they get older. Many pet owners aren’t prepared to pay for unexpected veterinary care costs when their cats get sick, especially if they don’t have pet insurance.

Frequently Asked Questions About Cat Ownership
What is the most popular cat breed in the US?
The most common cat breed you’ll find in someone’s home is the Domestic Shorthair, and many adoptable cats have Domestic Shorthair in their lineage. When it comes to purebred cats, Ragdolls, Maine Coons, Devon Rexes, Exotic Shorthairs, and Persians are among the most popular breeds in American families.
Is cat ownership less expensive than dog ownership?
In most cases, cats are less expensive than dogs. Due to their small size, they tend to eat less than dogs, and many cat toys and treats are cheaper than dog toys and treats. Pet insurance premiums are also usually lower for cats than dogs.
However, taking care of a cat still takes up a significant part of most people’s annual budget. So, it’s important to calculate costs thoroughly before bringing home a new pet cat.
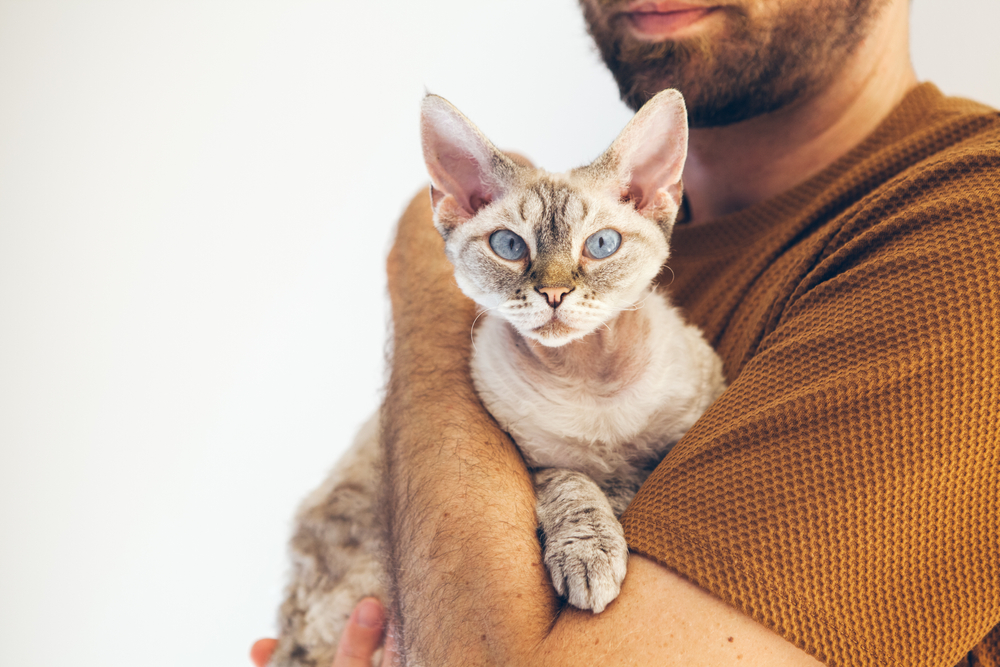
What is the average lifespan of pet cats?
A cat’s lifespan is affected by both genetics and lifestyle. Some cat breeds are known to live longer lives, and cats that have healthy lifestyles have a lower risk of shortened lifespans. In general, you can expect pet cats to live anywhere from 12 to 18 years, and indoor cats have longer life expectancies than outdoor cats.
How long can cats be left alone?
Your cat’s ability to be home alone will depend on their individual temperament and social needs. Some cat breeds are more social than others, and they don’t do well being by themselves for long hours. In general, it’s not recommended to leave your cat home alone for more than 8 hours at a time.
It’s a common myth that cats can be left alone for multiple days as long as they have food and water. However, most cats will feel distressed when their owners leave and are left home alone for more than 24 hours.
Cats are capable of forming strong bonds with people, and they have social needs. Failure to meet their social needs can cause emotional distress and lead to behavioral issues, including separation anxiety and engaging in destructive activities. Therefore, if you plan to leave your cats for a couple of days, make sure to arrange for cat sitters to take care of your cats while you’re away.

Conclusion
Cats are popular pets in many countries, and the most common way to acquire them is through pet adoptions. Cat adoptions have increased steadily over the past several years, and Millennials and Gen Z are most likely to own cats.
While taking care of cats generally costs less than caring for dogs, many people still face challenges with budgeting due to rising pet care costs. The most significant financial challenge is unexpected medical bills. Financial challenges have caused more interest in pet insurance and other methods of budgeting for pet care. It’ll be interesting to see how pet trends continue to change and adapt to modern cat ownership and what cat ownership will look like as we continue to follow pet trends in the US.
Featured Image Credit: evrymmnt, Shutterstock
[ad_2]
Source link
